


Unit 1 Proof
Cover Letter
This unit was mostly focused on geometry and trigonometry relating to two dimensional graphs. Particularly relating to graph geometry we spent a significant amount of time working on understanding how to read and analyze graphs and calculate the distance between points and how to find points in a graph. This was later used to help us calculate the size and angles of shapes within a graph field and, to help us orient ourselves throughout the rest of the unit. In particular we used the graph field to discover the equations for distance calculation between points (distance value of x, plus distance value of y), We learned how to calculate for an angle along a graph, and how to find the angle of an existing line on an graph, by discovering the intersect points of the line and then calculating the distance between the intersected points to discover the angle of the line. In that vein we also learned how to draw our own lines of best fit, doing so by calculating the average distance between points for our line, to best represent the data sets we need to display in a clean cut line format. Through the understanding of grid based geometry we also worked to understand the usage of geometric grids to predict the sizes and lengths of shapes displayed on the grid. To this end we studied the pythagorean theorem in order to predict and calculate the size and length of triangles, and through the use of triangles with known dimensions we also began to familiarize ourselves with how we can use the pythagorean theorem to calculate the size and shape of squares,rectangles and pentagons, likewise we could also use the triangles to calculate the area of countless other shapes. All of this to say that we used our understanding of grid based geometry and triangulation to discover the area and perimeter of different shapes, both regular and irregular in size and individual dimensions.
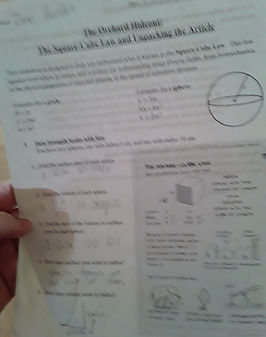
After finishing up our work with the grid system and the two dimensional geometry of the pythagorean theorem and other mathematical principles relating to it. We moved on to more advanced geometry in the form of calculating the area and perimeter of circles and ovals, both of which are much harder due to the fact that for lack of an better way to describe it they are both infinitely sided shapes, thus many of the traditional methods of finding the area of shapes was rendered null and void. We worked to develop an understanding of how we can mathematically find the values of circles, by applying the universal measurement of PI, and through a second set of trigonometry to break circles up into microscopic triangles. This was all topped off with an extensive set of new geometric laws regarding circles, including how to find the area and perimeter of a circle by first discovering its radius and circumference. From there we worked to understand a principle of three dimensional geometry referred to as the square cube law. The basis of this principle is that the larger the size of a three dimensional shape, the smaller the surface area of the shape will be relative to its volume. For example, assuming you have an two foot by two foot cube, its surface are to volume ratio would be 1 whereas the surface to volume ratio of 300 foot by 300 foot cube, would not actually be 1 to 1, the surface area would be lesser than the volume relative to the size of the shape. This of course was heavily reliant on the mathematical laws and principles we learned earlier on in the semester, and we proved it using our understanding of geometry and multiplication of two dimensional values along a three dimensional face.
Working with our understanding of geometry and grid based calculations we developed a series of proofs and evidence to confirm our findings. First we struggled to confirm the importance of proving one's discoveries by engaging with several articles and studies of the importance of the scientific method as applied to math. Thus for us to ensure our understanding of the principles we must be able to properly prove our formulas and solutions. One of the best ways to do so for geometry is a physical representation, such as a drawing or graphic. For example one way to prove one's claims is by the direct representation of a shape on a graph. In this regard we spend a sizable mini unit working on data priming and data representation using graphs and grids to display the point you are trying to make. We also through this medium worked to understand what bad representations of data look like. The most important tasks we completed in this regard were the times when we were trying to identify the worst represented data in a set, and determine what was wrong with graphs and charts provided by news sources. This was imperative in making sure that our own proofs and data sets were properly represented, and did not mislead the audience away from the conclusion that we want to properly represent. Finally we also worked on designing lines that properly express functions within a grid base, based on their angles and curvatures.
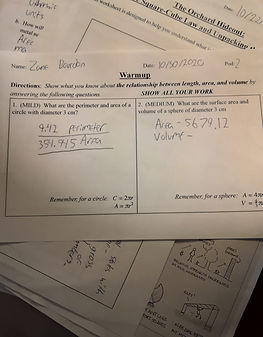
The Orchard Problem
The orchard problem is an issue of grid based intersectional calculations, and likewise an issue of logic and reasonable estimation. For the problem to be solved first the context of the scenario must be established, and the conditions of the conclusion confirmed. For the sake of a story let us assume that there are two young adults looking to build and house hidden from view of the general public (most likely in order to cook meth). The young couple decides that the best way to do this is to plant literally hundreds of trees around their meth cabin until they are unviewable to the outside world. They plan ahead however, and thus they determine it is in their best interest to plant the trees in completely equal proportions to each other on a grid based pattern. Their house of course would be in a clearing in the center of their orchard, surrounded by trees on all sides. The question they need to know the answer to, is how long it will take the tree trunks to be thick enough to properly obscure their hidden cabin from the watchful eyes of the feds. In essence they need to discover the best angle from which someone might look into their “orchard” and still be able to see their house through the trees, and also how long it will take before the saplings they planted grow enough to properly obscure their cabinlab. Then once they know how long it will take until someone can no longer see through the trees through the best angle of sight, they will finally have a perfectly isolated and well hidden get awayghettoway from the outside world.
The process to solve this problem is relatively simple, and draws upon all of the principles from the unit. First we must assume that the grid in question is equally spaced between each tree. Such as the display below. This allows us to draw an line of best sight,
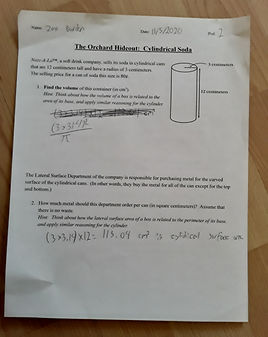
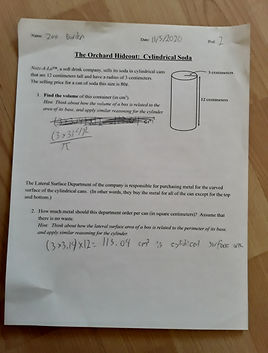
This of course being best described as a line from which the house will be seen for a maximum amount of time. In this case the line of best sight will be at an angle along the horizontal axis. Such as this.
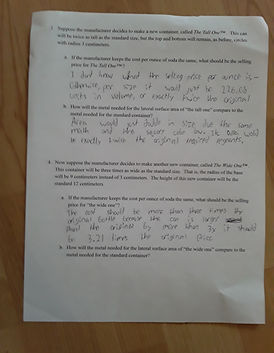
Hence the question of the age is not how long it would take for the tree trunks to be directly touching each other but how long it would take for the tree trunks to eclipse this angle. For that we need to assume that the tree trunks are one unit from each other (and that one unit equals ten feet), and that the tree trunks grow by a total of 2.5 inches squared each year, starting at an original girth of 5 inches. Then we simply calculate the angle of the line to determine how far the line of best sight is from the closest tree trunk.For that we can use the pythagorean theorem and basic trigonometry to determine the distance between the line and the nearest tree trunk, For this we simply find the value of the lower horizontal line, and also the vertical distance between the two points, from there we apply the pythagorean theorem to determine the length of the angle line (a(2)+b(2)=c(2)). Thus giving us an length and angle of the line of best sight, from there we determine the distance between the trunk and the line of best sight to be equal to 31.879 inches in distance between the line and the point of the trunk (minus 2.5 inches due to initial girth) resulting in an final answer of 11.75333 years, at 2.5 inches growth per year to eclipse the line of best sight and render the house invisible to the outside world.
Reflection
The unit was an extensive and interesting exploration into the field of geometry and besides for an grade school education in the basics of shapes, it was my first introduction to advanced trigonometry and grid based prediction. Thus it was also my first introduction into trying to design lines and curvatures for mixed purposes. Through this medium it drastically altered my understanding of how values and points on a grid are related, and by extension how the arithmetic used to quantify the values is highly correlated. The laws of arithmetic are very connected with geometric principles, and the means by which one discovers the values of variables in arithmetic are directly correlated with the resulting geometric values of shapes. Specifically regarding this I feel that the new knowledge I have gained regarding the discovery of distances between points using triangles and the pythagorean theorem could be extremely beneficial in the future, and that likewise I can apply the new information to my chosen career of security, and national defense in an multitude of violent scenarios. The potential application of being able to determine the location of opponents could drastically increase my operational efficiency, thus I am extremely grateful for the opportunity to learn this new function and field of geometry.
In addition to this new knowledge I have also increased my ability using several different forms of calculating materials, including programs on my computer, and graphic apparatus. To More efficiently display my and compute arithmetic and geometric formulas and principles. Of these the most important being the program desmos, which is an excellent resource for anyone looking to get into the subject matter. I also learned that I genuinely hate, any and all math involving circles, mostly because they necessitate an entirely divergent form of geometric calculations hence, rendering massive amounts of work meaningless. My ability with grid based math has drastically increased, as my newfound tools online have allowed me to expand my experiences with calculating closed shapes in a math formula. I am happy to report my exceeded expectations, in this regard, most especially as my expectations regarding grid based geometry were non existent and thus by extension, easily passed. Hopefully through the continued application of my online tools and newfound list of formulas I can continue to develop my skills and geomancer, into the future where I can hopefully master three dimensional geometry using the principles we have developed here over this unit, and apply my learning to my future career in national defense and operational security.
Unit 1 Reflection
Unit 2 Reflection
The Writeup
For the solution to this project we employed a new set of mathematical principles that I both cannot replicate, and barely comprehend. However in the interest of presenting an unified and cohesive report on the mathematical progress made by me and my group, I will attempt to explain the concepts and theorems we applied. Among them the principles of matrix and linear equation calculation. The usage of which was instrumental in the eventual development of our final solution to the problem. Firstly the principle most integral to the development of our solution was the matrix multiplications system. The application of which allowed us to mathematically determine the optimal combination of restrictive values to reach an cheapest solution possible. To this end we first had to determine the constraints of the problem, which were as follows.
D=>300
DR*R=50
DR*D=500
OF*R=200
OF*D=2,000
BS*R=100
BS*D=1,000
DR=300 Acres
OF=100 Acres
BS=150 Acres
The cost of development for each of the land parcels is wildly different and constantly the cost of recreational land is much cheaper, however the confines of the problem also clearly state that at least 300 acres have to be devoted to development. While the obvious solution to just make everything into recreational land and thus minimize the cost is appealing, it is not applicable within the context of this problem. We must find a way to minimize the cost of the development of territory while at the same time ensuring that the constraints are met to perfection, i.e that it has at least 300 acres of development, and no more than 200 acres of development in OF and BS. While the obvious pathway to solving this problem is to simply maximize the amount of development of industry in the cheapest possible area (DR) and then finish meeting the minimum by investing D in the second cheapest area of investment (BS) then to spend the rest of the available land in recreational development, thus minimizing the cost. While this method would work, it is not the means that we used to determine the optimal solution. Instead we used a new method to determine what combination of values reached optimal ends.
Through a system of matricing we can determine the possible outcomes that satisfy the constraints through a series of multiplication and restricting combinations. How we do this is simple. Firstly we must assign values of 1-9 to the nine possible combinations of the above variables like so.
-
RR + RD = 300
-
AR + AD = 100
-
MR + MD = 150
-
RD + AD + MD ≥ 300
-
AR + MR ≤ 200
-
AR + RD = 100
-
RR ≥ 0
-
AR ≥ 0
-
MR ≥ 0
-
RD ≥ 0
-
AD ≥ 0
-
MD ≥ 0
Once we have our variables we can figure out what combinations of them are functional! Due to the constraints we know that the combinations of the variable will never equal more than 500 acres, or more than 200 acres of R thus we are able to form a list of possible combinations such as the following.
1,2,3,4,6,4,5
1,2,3,4,6,7,5
From there we can begin to apply our combination systems into the matricing equations. We can do this by figuring out how many of each variable there is in a combination. Within the context of our problem there will only ever be one of each variable within a combination. I.e there will only ever be one of R(R)+R(D)=300 within a single combination. Thus an potential matrix input would be 1,1,1,1,0,0,0 and then replicated over and over again with the input combinations to be input into an single matric like so
[1,1,1,1,0,0]
[1,1,0,1,0,1]
Finally we take the set of binary variable combinations and combine them with alternative sets of variable combinations to result in a potential final combination of variable values. These final combinations are the different possible outcomes for the variables above, and by finding the perfect combination we can optimize our spending to the absolute minimum. In the image below you see the process we employed of making the variable binary into final combinations. Taking the binary and applying it in the multitude of possible outcomes. It shows just a sample of the work we did to ensure that the binary variables added up into an possible final conclusion, that satisfies both the constraints and the maximizes the profit to expense ratio (i.e ensures that the development people are getting their fair share of the proverbial pie). The final results show the outcomes of each data set, as well as the total cost of the potential combination of variables.
Datasets being multiplied:
Final Results:
Thus by finalizing the combinations and the possible outcomes of the combinations we can reach an optimal final solution by simply adding the different values together with their assigned values to reach an final solution satisfying both the constraints and the minimum cost of investment.
The Reflection
Over the course of this project I would say that my collaborative skills have grown in a reflective manner to the rest of the year, while I would not say that my growth in this project has eclipsed any of the other pieces of work we have down, in the regards of cooperation this is the first group project i have done in years. Mostly because the last time I did a group project was before the collapse of standard social conduct in the face of an outbreak. I would say that I have grown in working with a group, as I have regained the skills to work with a group at all. All in all I am a terrible person to work with, for a multitude of reasons. Mostly having to do with the fact that I am really bad at communicating, especially when it comes to complex ideas within a group setting, I could work to improve this in the future assuming that I get another opportunity to work in a group. Particularly within the confines of this group I was especially worthless as I have no real understanding of any of the math we have been doing, or really any math beyond basic 8th grade schooling. In total I would not say that I have developed my ability to work in a group by any significant margin, save for the fact that I am slowly regaining the social skills that have melted off me in the last few years.
My experience with online learning was more counter intuitive to the development of me as a learner than any amount of words can properly express. I literally have backslid into my 8th grade state, both socially and academically. In regards to math I would say that the disease has been a massive backlog and deterrent of issues, each of which working to ensure that I achieve peak inefficiency. While my religion forbids self pity, I feel no guilt in saying that the lockdowns have slowed me down by a significant margin. The simple fact that I was deprived of the ability to have things explained to me has drastically layered my ability to learn math and develop myself as an mathematician. Having things explained to me in such a way as a person can only do face to face, is in my opinion the only way for a regular person to learn. Thus through the absence of this type of structure, I was rendered incapable of learning new principles. Likewise even with the somewhat frequent return to the classroom, I have been so far behind on math that I really don’t understand what it is you are saying. I barely understand the basic principles of matrices. In conconclusion, I would say that the remote learning process has been an unprecedented retardant both for me, and all other students in the developed world.